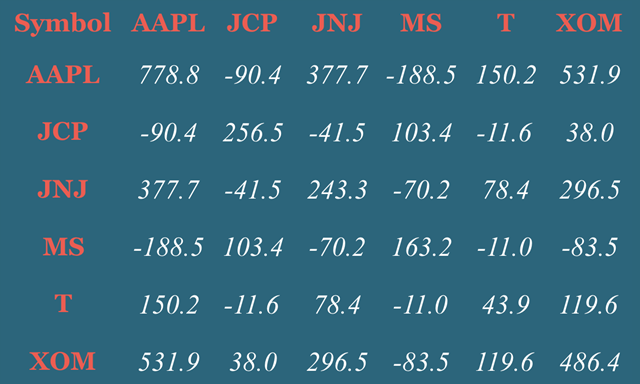
Covariance matrices (aka Variance-Covariance matrix) are commonly used in stock portfolio, risk assessment and multivariate analysis in general. Covariance is a measure of how much two variables change together. If we take the example of stocks, if when one stock has good returns, another one also has strong returns and when it loses value, the other also does, their covariance would be positive. If their behavior is the opposite e.g. when one gains, the other one tends to lose value, covariance would be negative. While the sign of covariance shows the relationship, since it is not normalized like correlation coefficient, the magnitude of the covariance is not easily interpretable.
I had done a correlation matrix example earlier that compared cars based on their properties (mpg, hp etc.) and received a lot of questions about how it can be applied to time series data. So I thought it would good to put together an example that calculates covariance with the same technique and using stock market data and kill two birds with one stone.
In this example I have 14 years of data for 6 stocks adjusted for splits and dividends. You can click the image below to view the visualization on Tableau Public and download it if you like so you can take a closer look at how it is built.
Each cell displays the covariance of stocks that corresponds to its column and row name e.g. For Apple Inc. and JC Penney covariance is –90.4. Enjoy!

Hi Bora, Great post! Would you mind explaining the table calc a bit? I’m having trouble comparing your table calc w/ the usual covariance formula. Thank you!
Reblogged this on Sandwhich.co.
Hi Bora, do you calculate the covariance in excel first? I am trying to replicate this for stock monthly returns and correlation and create a correlation matrix, but am having trouble. Should i perform the calculations in excel first, or do it Tableau? Thanks!