When the data has a lot of features that interact in complicated non-linear ways, it is hard to find a global regression model i.e. a single predictive formula that holds over the entire dataset. An alternative approach is to partition the space into smaller regions, then into sub-partitions (recursive partitioning) until each chunk can be explained with a simple model.
There are two main types of decision trees:
Classification trees : Predicted outcome is the class the data belongs.
Regression trees : Predicted outcome is continuous variable e.g. a real number such as the price of a commodity.
There are many ensemble machine learning methods that take advantage of decision trees. Perhaps the best known is the Random Forest classifier that constructs multiple decision trees and outputs the class which corresponds to the mode of the classes output by individual trees.
Let’s start with a classification tree. For decision trees I will use the package rpart but maptree, tree and party are some other packages that can be used to same effect.
All the data used in the examples below are retrieved from UC Irvine Machine Learning Repository. In the example workbook you can find links to documentation and credits for each dataset.
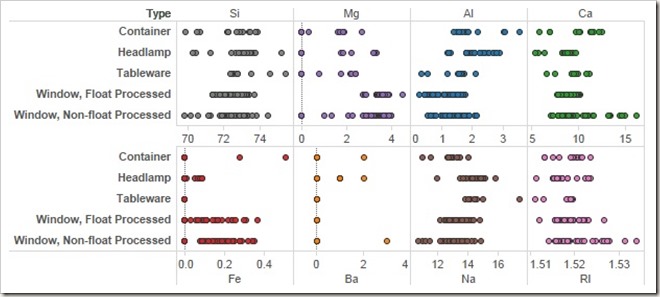
First dataset contains composition (Sodium, Calcium, Magnesium… content) and physical properties (RI – Refractive Index) of samples for different types of glass. If you were to find broken glass in a crime scene, would you be able to tell what it is ?

Here is how you can create a classification tree to answer this question:

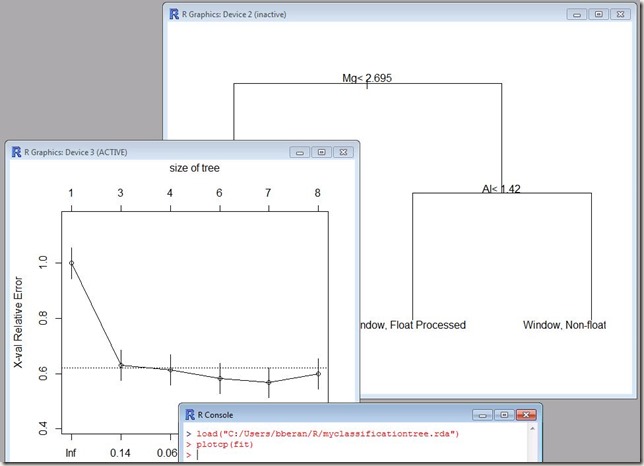
This calculation will just work as long as you have Rserve running and rpart package installed since it is self-contained as it loads the library, trains the model and then uses the model to make predictions within the same calculation. Model fit happens in the part underlined in orange, the tree is pruned to the level where minimum error occurs in the part underlined in blue and finally the prediction happens in the part underlined in green.
Alternatively you could use the control setting in rpart function to impose some rules on splits. In the example below control=rpart.control(minsplit=10, cp=0.001) requires at least 10 items in a node before attempting a split and that a split must decrease the overall cost complexity factor by 0.001.

You may have noticed that in this example we are using the same dataset for training and prediction, not to mention we are not looking at any diagnostic measures to gage the quality of fit. I did this firstly because I wanted to provide a simple, self-contained example that just works and secondly, the reason for the blog post is to show how a particular technique can be used from within Tableau as opposed to providing guidelines for model fitting and selection. In real life scenarios, you would train the model using one “tagged” dataset, verify the quality, save the trained model and use it to predict with different datasets serving as input. Save and reuse workflow has been explained in detail with an example in my earlier blog post about logistic regression with Tableau and R. But I haven’t talked about how you can use the same approach to iterate on the model by going back and forth between your favorite R development environment and Tableau as needed before you deploy the final model for everyone to use via a Tableau dashboard.
You will notice a sheet in the example workbook named SaveTree. This sheet contains a calculated field that has the following line:
save(fit, file = "C:/Users/bberan/R/myclassificationtree.rda") |
which saves the fitted model to a file on my computer. Once you update the file path to a valid path on your computer and it successfully saves, you can easily open the model from your R environment and examine the tree structure and relevant statistics, prune the tree etc.

Once you’re done you can run the same line from your R console and overwrite the file, then read it from Tableau to use for predictions.
SCRIPT_STR('library(rpart); |
There is a dedicated sheet in the example workbook that uses random forest approach on the same dataset. It uses the package randomForest which you will need to install. However the syntax is almost identical to the classification tree example above so I will skip over it to move on to regression trees right away.
For regression tree example, I will use a separate dataset which contains make, model year, displacement, # cylinders etc. for different cars based on which we will try to predict MPG.

Once again using the rpart package, the calculation can be written as follows. It is similar to the classification tree script. The minor differences are highlighted. Note that the discrete variables such as make, origin and # cylinders are used as factors.

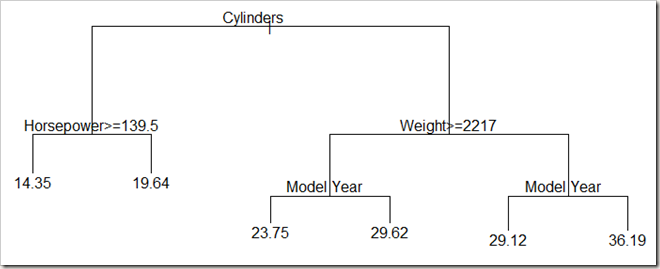
After some pruning, the regression tree looks like the following when you draw it in R where leaf nodes show the MPG values for cars classified under that group.

You can find the Tableau workbook with the examples HERE.
Hello Sir,
I was working on the classification tree analysis and wrote the following codes in R:
iris=read.csv(“iris.csv”)
library(rpart)
iris.rpart=rpart(Species~Sepal.length+Sepal.width+Petal.width+Petal.length, data=iris)
plotcp(iris.rpart)
iris.rpart1=prune(iris.rpart, cp=0.047)
myplot=plot(iris.rpart1,uniform=TRUE)
text(iris.rpart1, use.n=TRUE, cex=0.6)
I tried to integrate this in tableau using the following codes:
SCRIPT_STR(‘library(rpart);iris_rp = rpart(Species~ Petal_length+Petal_width+Sepal_length+Sepal_width, method=”class”,data.frame(
Species = .arg1,
Petal_length = .arg2,
Petal_width = .arg3,
Sepal_length = .arg4,
Sepal_width = .arg5),
iris_rp2=prune(iris_rp, cp=0.047),
t(data.frame(predict(iris_rp, type=”class”)))’,
ATTR([Species]),SUM([Petal_length]),SUM([Petal_width]),SUM([Sepal_length]),
SUM([Sepal_width]))
Tableau accepted this as a valid calculation but gave error messages when I tried to use this field for visualization:
Error in base::parse(text = .cmd) : :9:0: unexpected end of input
7: iris_rp2=prune(iris_rp, cp=0.047),
8: t(data.frame(predict(iris_rp, type=”class”)))
^
Could you please help me with this. Could not comprehend where did I go wrong.
Thank you in advance.
I think the issue is the fact that you’re using , where you should be using ;. It should be iris_rp2=prune(iris_rp, cp=0.047); not iris_rp2=prune(iris_rp, cp=0.047),
Also in the previous line it should be Sepal_width = .arg5); instead of Sepal_width = .arg5),
Thank you Sir. That worked.
In my tableau graph, each species got 50 data points but R had segregated it as 50:54:46. Do I put extra codes when working in tableau to replicate the same?
If I understand the question correctly, that shouldn’t matter. If you set Table calculation settings such that there are no partitions, you will be sending 150 data points to R and getting 150 back while they may be classified into N number of groups with differing number of members. Results you’re getting are one class assignment per data point regardless.
hi sir
i have a tableau public. can i use of R package in it??
thanks
R scripts are currently not supported on Tableau Public.
thanks.i installed tableau Desktop.
hi sir
how I do Back-Propagation Neural Network model in Tableau?
I waiting for your help.
thanks
hello
how I can give the test data for classification tree or random Forest NN.
thanks
Pingback: “The Winner Takes It All” – Tuning and Validating R Recommendation Models Inside Tableau ← Patient 2 Earn
Good day Sir,
I am doing my high school thesis on fish survival and I have a problem with my model. My syntax is:
SCRIPT_REAL( ”
## Defining Variables
[GVA]<- .arg1,
[Emp]<- .arg2,
[Surv]<- .arg3,
[CP]<- .arg4,
## Fitting the Model
fit <- lm( GVA ~ Emp + CP + Surv)
fit$fitted
"
,SUM( [GVA]), SUM([CP]), SUM([Emp]), SUM([Surv]))
but I received an error saying:
Error in base::parse(text = .cmd) : :5:5: unexpected ‘[‘
4:
5: [
^
Can you guide me through? Thank you so much.
Can you try removing [ from your SCRIPT. I.e. instead of
[GVA]<- .arg1,
[Emp]<- .arg2,
[Surv]<- .arg3,
[CP]<- .arg4,
try using
GVA <- .arg1,
Emp <- .arg2,
Surv <- .arg3,
CP <- .arg4,
and see if that helps?
hello
I was working on the classification tree analysis and wrote the following codes in Tableau:
SCRIPT_REAL(‘library(rpart);
fit=rpart(Class ~ Slength + Swidth + Plength + Pwidth , method=”class”,
control=rpart.control(minsplit=10,cp=0.001),
data.frame(Class = factor(.arg1),
Slength=factor(.arg2),
Swidth=factor(.arg3),
Plength=factor(.arg4),
Pwidth=factor(.arg5)));
fit<-prune(fit,fit$cptable[which.min(fit$cptable[,"xerror"]),"cp"]);
t(data.frame(predict(fit,Class="class")))[1, ];',
ATTR([Class]),AVG([Slength] ),AVG([Swidth] ),AVG([Plength] ),AVG([Pwidth] ))
Tableau accepted this as a valid calculation but gave error messages when I tried to use this field for visualization:
Error in 1:numclass : result would be too long a vector
please help me with this .thank you
I suspect the issue is that you are passing the variables as factors. Factors are ideal for categorical variables These are continuous variables. Decision tree will create dummy variables for anything you pass as factors. In this case the are probably hundred unique values for Plength, Pwidth etc. that’s why you are seeing this error.
Hello. How can I display the tree structure returned by the “rpart ” function in Tableau? I can see how I can save the .RDA file, etc. etc. Why bother with Tableau if I need to use R to do my visualization?
Good question. Maybe I should write about that, too but why do you think a visual tree layout is the end product of this process?
If classification gave you customer segmentation, wouldn’t you look at how purchasing habits of each group changed over time (line chart), how many of your customers belong in each group (bar chart, pie chart…) or how they are geographically distributed (map)…?
Never said the tree layout was the (or an) end of the model. One of the nicer things about a decision tree is a flow chart like structure, easy to explain to / understand by even lay people. Regression models also have similar a similar advantage. In another entry of this blog, there is an example where a scatter plot was overlaid with a linear fit of the data. The trend (and correlation) of the data in the scatter plot became easier to see because of that trend line.
My point is, segmentation, trend lines etc are important to see, but I would like to visualize / display how these came about as well.
I also noticed in the above example is that the “rpart” type variable “fit” is not imported into Tableau, just the predicted values. As you have displayed in the figure “examining the model in R console” above, that variable contains “quality of fit” information. Is it possible to import such a variable into Tableau?
Hello, i have the same issue i would like to see the tree en tableau. I wonder if you write someting about it. thanks for the time.
Hi Bora,
I have a dataset contains 15k rows and I am trying to build a decision tree to predict whether a particular call type is bad or good (0,1). However, I have an error message:
Error in 1:numclass : result would be too long a vector
script_str(‘
library(rpart);
a<-data.frame(badcall=.arg1, hold=.arg2, network=.arg3, delay=.arg4, talk=.arg5, confer=.arg6, ring=.arg7);
fit=rpart(badcall~hold +network + delay + talk+ confer+ ring, method="class", a);
fit=prune(fit, fit$cptable[which.min(fit$cptable[,"xerror"]), "CP"] );
t(data.frame(predict(fit, type="class")))[1,];',
attr([badcall1]), avg([Hold Time]), avg([Network Time]), avg([Delay Time]), avg([Talk Time]), avg([Conference Time]), avg([Ring Time]))
I tested my code in R and they work perfectly fine, so I guess maybe tableau has a maximum capacity of storing a row vector?
Please advise.
Thanks,
Mark
Hi Mark,
Can you try passing badcall as factor?
as.factor(badcall)~hold….
And check what is being passed between R and Tableau? If you use Rserve in debug mode you can see the traffic. Are right number of rows passed, is badcall being passed as 1 and 0 as expected etc. Or are there NULLs…
Bora
Hi Bora, I downloaded the Tableau wokbook “DecisionTreeExample” from your SkyDrive. It has, however, some links to your local library files and Tableau says that it cannot run the scripts. How can I fix that and run the example?
Congrats for a great blog and best regards,
Enrique.
Hi Enrique,
Did you configure Rserve in Tableau? Help> Settings and Performance> Manage External Services (or Manage R connection) depending on Tableau version.
Thanks,
Bora
I tried the same code for decision tree and getting bellow error,
An error occurred while communicating with the RServe service.
Error in 1:numclass : result would be too long a vector
SCRIPT_STR (‘
library(rpart);
fit <- rpart(as.factor(Outcome_Level) ~ Triage_Priority + Wait_Limit + Waiting_Time + Total_Time + Category + Presenting_Problem,
method = "class",
data.frame(Outcome_Level = factor(.arg1),
Triage_Priority = factor(.arg2),
Wait_Limit = .arg3,
Waiting_Time = .arg4,
Total_Time = .arg5,
Category =factor(.arg6),
Presenting_Problem = factor(.arg7)));
fit <- prune(fit,fit$cptable[which.min(fit$cptable[,"xerror"]),"CP"]);
t(data.frame(predict(fit, type = "class")))[1,];',
attr([Outcome Level]),
Attr([Triage_Priority]),
AVG([Wait_Limit]),
AVG([Waiting_Time]),
AVG([Total_Time]),
attr([Category]),
ATTR(([Presenting_Problem])))
Please provide helpful advise
Does this code work in R without Tableau? Without the data, I can’t tell what’s triggering the error but it does’t look like this is a Tableau issue.
If I am passing the variables to R already aggregated (sum, avg, etc) , how R is outputting a prediction to every data point?
If you’d like to pass them without aggregation, you can uncheck “Aggregate Measures” option from the Analysis menu.
HI Bora!
I want to visualize variable importance in Tableau. For Example for Rpart funktion.
This does not work:
SCRIPT_REAL(‘library(rpart);
fit = rpart(formula = Sec_SIM ~ Cycle_Month + Motiv_Data + Product_Family_Desc ,
method = “class”,
control = rpart.control(minsplit=10, cp=0.01),
data = data.frame(Sec_SIM = .arg1,
Cycle_Month =.arg2,
Motiv_Data=.arg3,
Product_Family_Desc=.arg4
)
)
io <- fit$variable.importance'
, ATTR([Sec_SIM]),ATTR([Cycle Month]),ATTR([Motiv Data]), ATTR([Product Family Desc]))
Can you help here? Thank you!